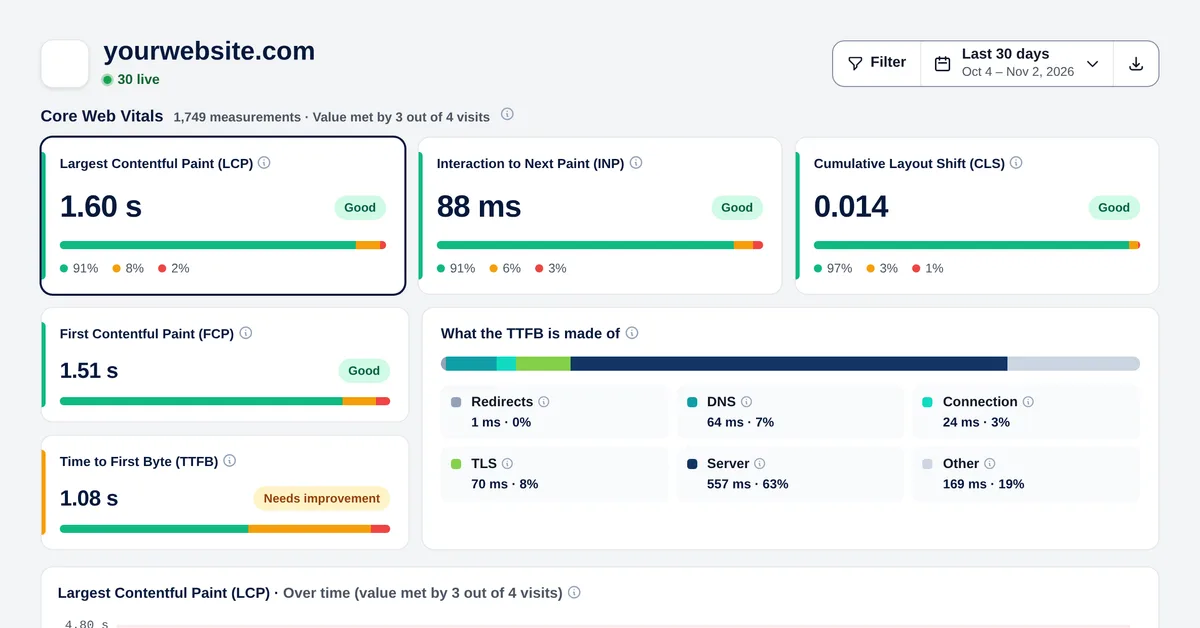
Largest Contentful Paint, Interaction to Next Paint and Cumulative Layout Shift in large cards, plus First Contentful Paint and Time to First Byte. Each with the share of good, needs improvement and poor visits.
LCP, INP and CLS at the 75th percentile
FCP and TTFB
Daily chart over Google’s thresholds
What your TTFB is made of
A slow first byte can come from redirects, DNS, the connection, TLS or the server itself. Overtracking splits the time so you know where to act.
Redirects, DNS, connection, TLS and server
Milliseconds and share of each step
Before and after a hosting change
By page, device, country and browser
Find the templates and the countries where your website is slow. Every row shows the 75th percentile of each metric with its colour.
Breakdown by page, device, country, browser and system
Latest measurements, one by one
CSV export
Frequently asked questions
Is this field data or lab data?
Field data: it’s measured in the browsers of your real visitors, not in a simulation.
Why the 75th percentile?
It’s Google’s criterion: a metric is good if at least 3 out of 4 visits meet it.
Does it slow down my website?
No. Measurements come from the browser’s own performance APIs, without blocking the page.
Can I turn it off?
Yes. Core Web Vitals can be turned on or off in the website settings.

 Español
 Deutsch
 Français
 Italiano
 Português
 中文
 日本語
 한국어