
 Español
 Deutsch
 Français
 Italiano
 Português
 中文
 日本語
 한국어

One screen, all the answers
How many people visit you, where they come from, what they read and whether they convert, at a glance.
- Six key metrics with comparison
- Sources, pages, countries and devices
- Goals and their value
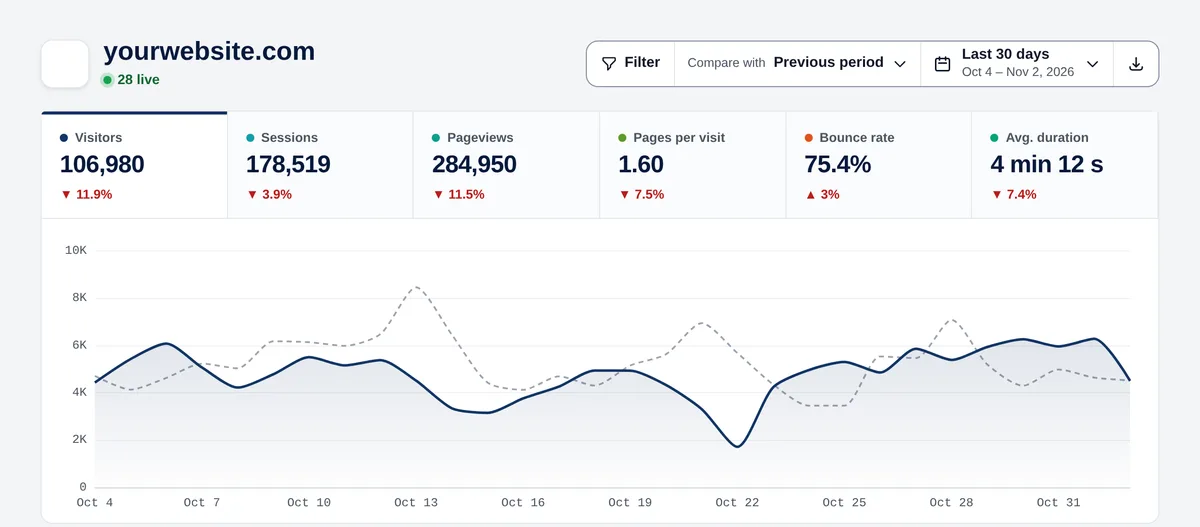
The metrics that matter on one screen, in plain language. No reports to build, no menus to learn.
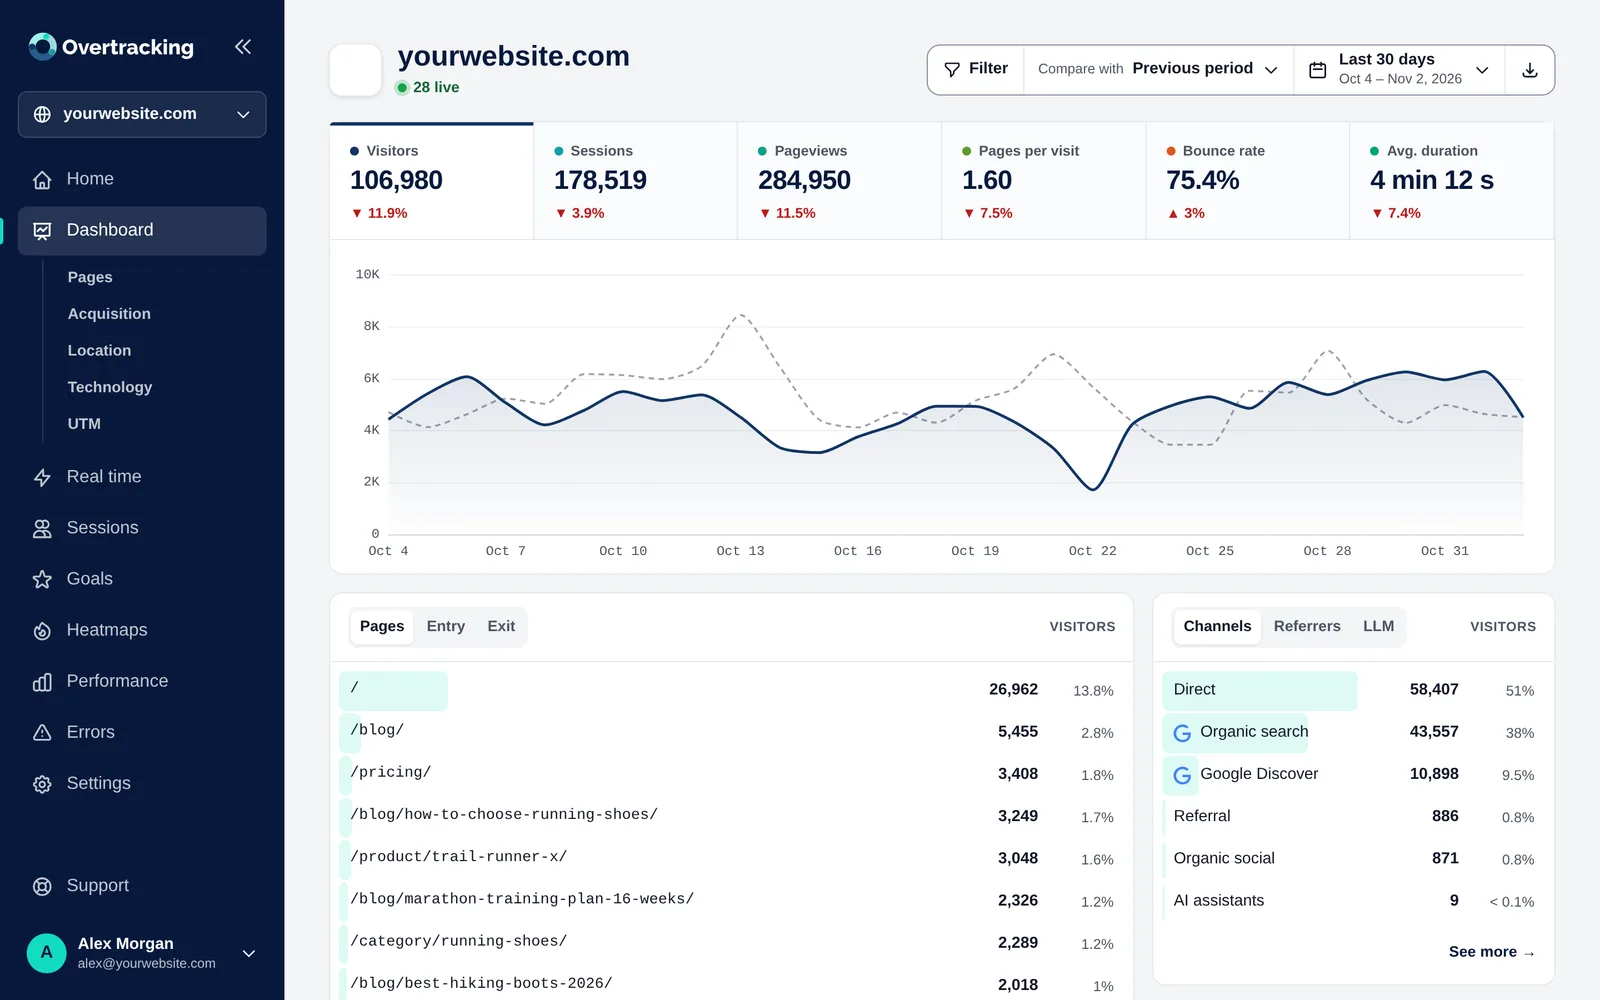
How many people visit you, where they come from, what they read and whether they convert, at a glance.
Click any source, page or country and the whole dashboard filters by it.
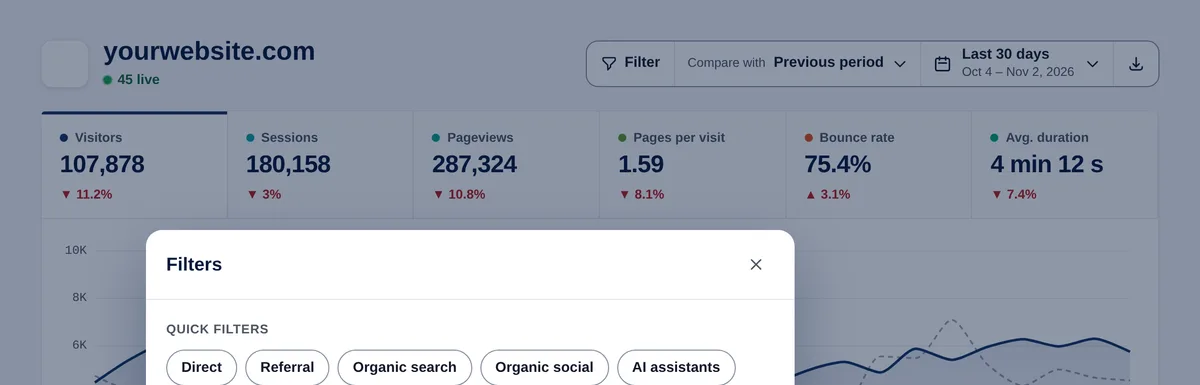
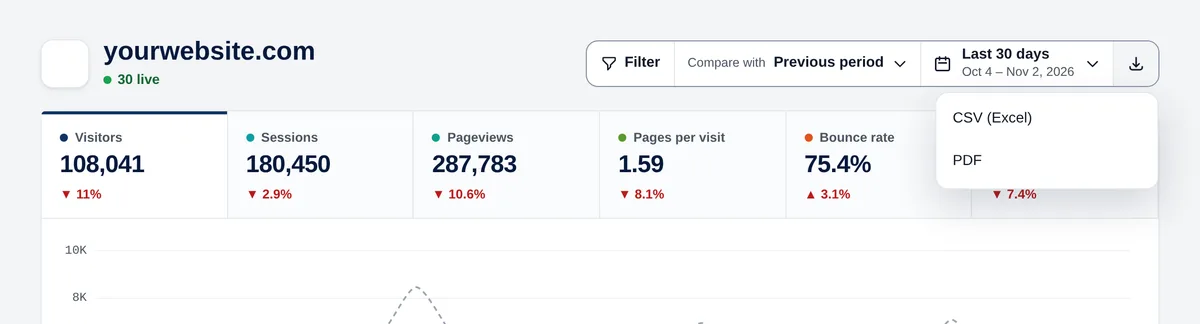
Invite your team or clients, receive weekly reports by email or export a PDF.
No. Installing it is pasting one line of code, and the panel shows the data without configuration.
No: it also includes heatmaps, goals with value, JavaScript errors and Core Web Vitals, each in its own section.
Yes, free for 7 days.
Try it free for 7 days. No cookies, no banners, no credit card.
Start your free trial
