
 Español
 Deutsch
 Français
 Italiano
 Português
 中文
 日本語
 한국어

The metrics and their thresholds
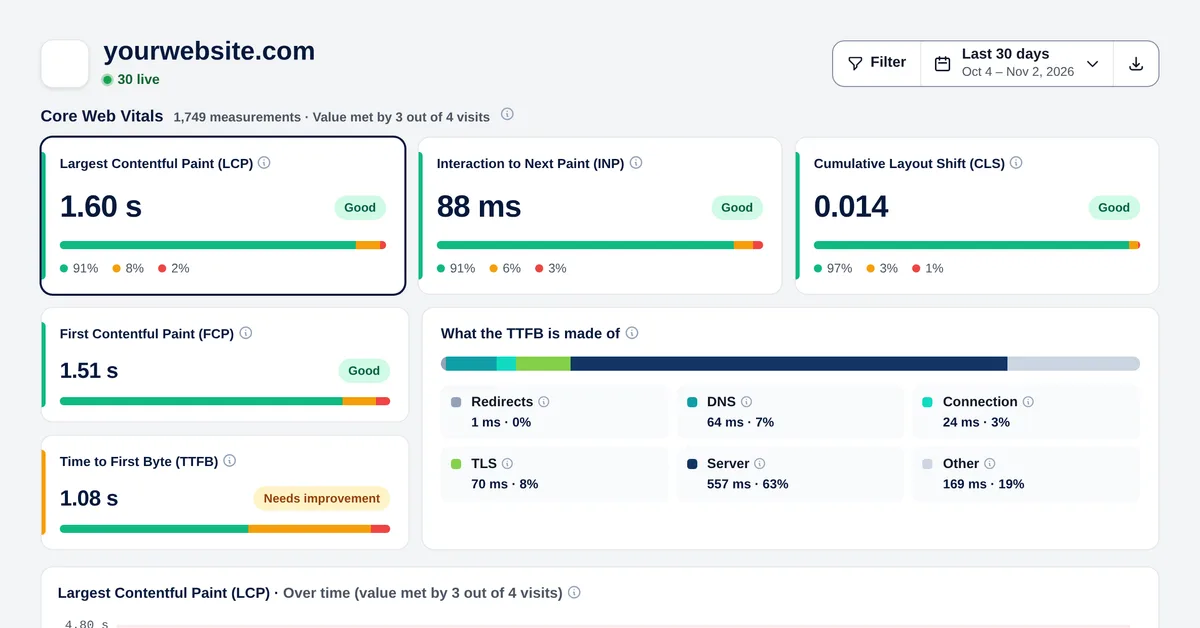
| Metric | Measures | Good | Poor |
|---|---|---|---|
| LCP | When the main content (the biggest image or text) appears | ≤ 2.5 s | > 4 s |
| INP | How fast the page responds to clicks and taps | ≤ 200 ms | > 500 ms |
| CLS | How much the content jumps while loading | ≤ 0.1 | > 0.25 |
| FCP | When the first content appears | ≤ 1.8 s | > 3 s |
| TTFB | When the server starts sending the page | ≤ 0.8 s | > 1.8 s |
In between is “needs improvement”. The value shown is the one met by 3 out of 4 visits (the 75th percentile): Google’s criterion, so that a few very slow or very fast visits don’t distort it.
What your TTFB is made of
A slow first byte is split into steps, in milliseconds and percentage:
- Redirects: jumps before reaching the page (http to https, non-www to www). Link directly to the final address.
- DNS: finding your server. A fast DNS provider helps.
- Connection and TLS: opening the connection and agreeing on https.
- Server: how long your server takes to build the page. A cache or better hosting usually fixes it.
Find where it’s slow
- Click a metric to see it day by day over the good, needs improvement and poor bands.
- Break it down by page, device, country, browser or system.
- Check the latest measurements one by one if you need detail.
Tip: Look at mobile separately: it’s usually much slower than desktop and it’s what Google uses first.
Turn the measurement on or off in Settings → General. Everything can be exported as CSV.