
 Español
 Deutsch
 Français
 Italiano
 Português
 中文
 日本語
 한국어

Choose the period
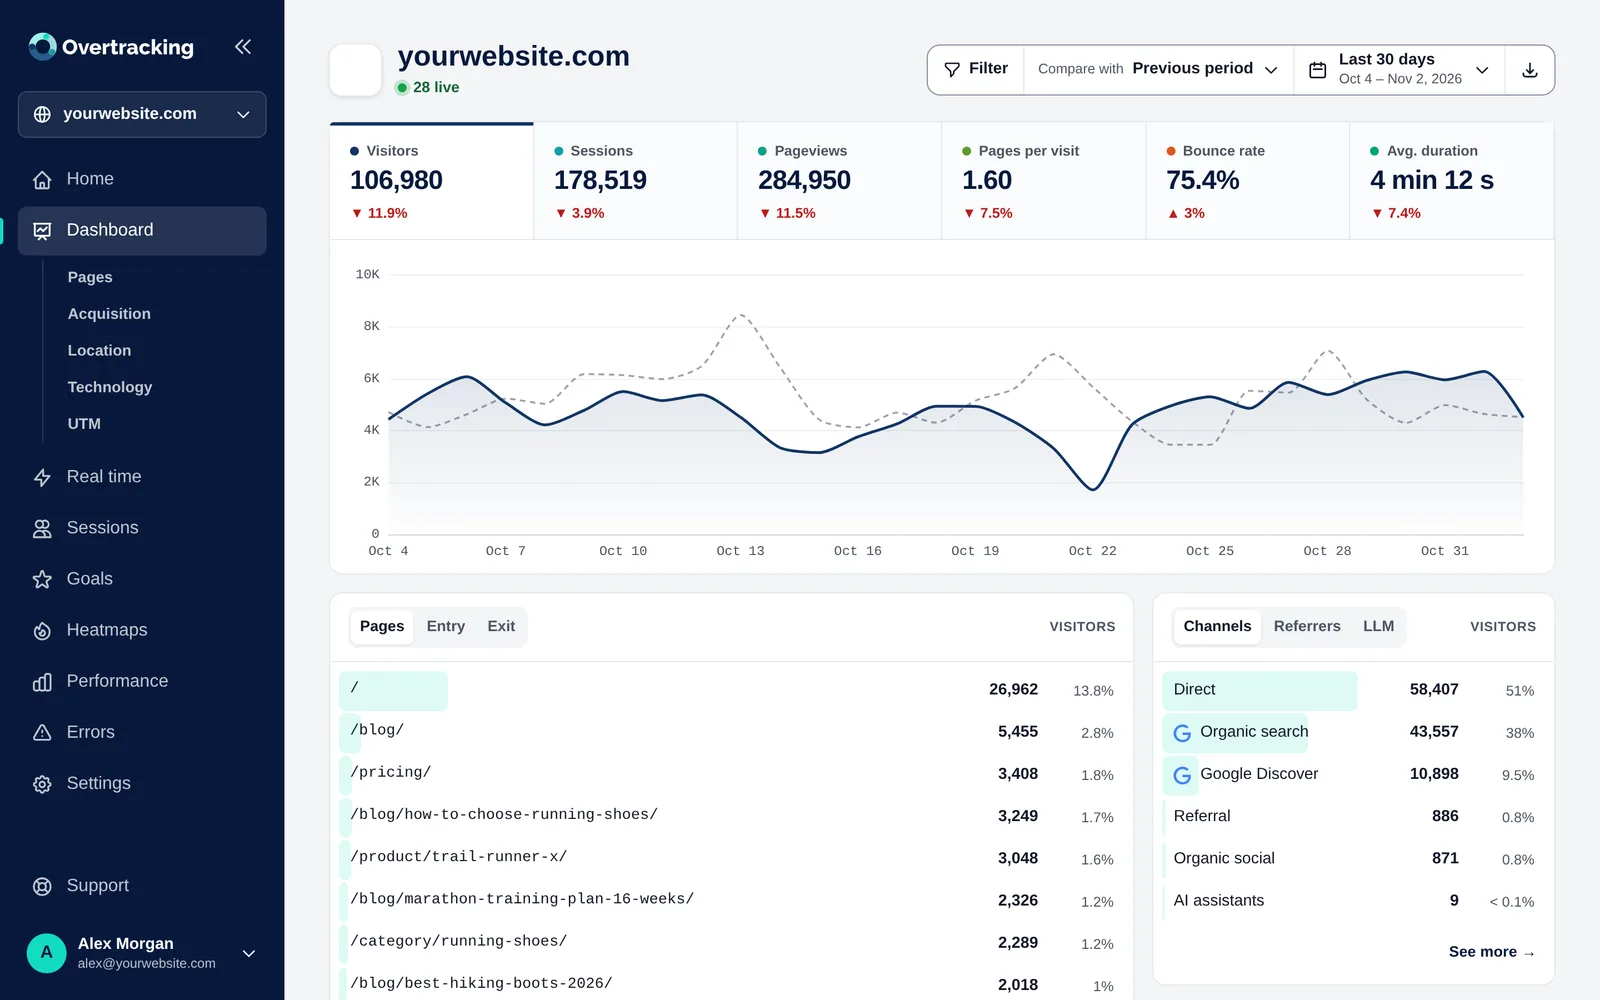
- Click the period at the top right.
- Choose a preset (today, yesterday, last 7 or 30 days, this month…) or two days on the calendar for a custom range.
- Optional: turn on “Also filter by hours” to look, for example, only at 9:00 to 14:00.
- Click “Apply”.
Your choice is remembered for all your websites.
Compare with another period
With “Compare with” the chart shows the previous period as a dashed grey line, and every metric shows its change. Hover over the chart to see the day, the value and the value of the comparison.
Tip: To know if a campaign worked, choose its days and compare with the previous period of the same length.
Read the chart
- Click a metric (visitors, sessions, bounce rate…) to see it on the chart.
- Drag the mouse across the chart to zoom into a stretch: the period changes to those days (or hours).
- Points are grouped by hour, day or month depending on the length of the period.
The reports below
Under the chart, each card answers a question. Each one has tabs:
| Card | Tabs | Answers |
|---|---|---|
| Pages | Pages · Entry · Exit | What is read, where visits start and where they leave |
| Acquisition | Channels · Referrers · LLM | Where visitors come from |
| Location | Map · Countries · Cities | Where they are |
| Technology | Devices · Browsers · Systems · Screens · Languages | What they use |
| UTM | Source · Medium · Campaign | Which campaigns bring them |
The bar behind each row shows its share of the total. Hover over a row to filter by it, open the URL or see the page of that URL.
“See more”: the full table
- All rows, loaded in batches of 100 as you scroll.
- Click a column title to sort; click again to reverse.
- Search box: type part of a name (“méx” finds México).
- Each row shows its change against the comparison period, or “New” if it didn’t appear before.
- “Export this table” downloads all rows as CSV.